
Quickstart
In five minutes you will build a small, labeled dataset of building footprints over Amsterdam’s Eastern Docklands: Esri aerial imagery at about 0.36 m per pixel, OpenStreetMap building polygons as labels, cut into 256 × 256 patches with a leakage-safe train/val/test split.
You need Python 3.10+ and an internet connection. Everything below is real output from mapcv.
-
Install
Section titled “Install”Terminal window pip install mapcvCheck it worked with
mapcv --version. More options: Installation. -
Get some labels
Section titled “Get some labels”Make a working folder and download the example building outlines (967 OpenStreetMap polygons, © OpenStreetMap contributors, ODbL):
Terminal window mkdir buildings && cd buildingscurl -LO https://raw.githubusercontent.com/tahamukhtar20/mapcv/main/examples/quickstart/buildings.geojsonAny polygon GeoJSON or KML in longitude/latitude, or a GeoPackage, Shapefile or GeoParquet file in any CRS, works the same way; see Prepare labels.
-
Write a config with
Section titled “Write a config with mapcv init”mapcv initmapcv initasks a few questions in four steps and writesmapcv.yaml. Type the answers shown after the prompts below; press Enter for the others to accept the default:Terminal window $ mapcv init╭─ mapcv init ─────────────────────────────────────────────────────────────────────────╮│ Answer a few questions to get a working config. Press Enter to accept a default. ││ Change detection and regression need before/after pairs or a raster of values: start ││ from mapcv init --template change or --template regression. │╰──────────────────────────────────────────────────────────────────────────────────────╯1/4 Imageryesri Esri World Imagery — sub-metre RGBsentinel2 Sentinel-2 L2A — open 10 m multispectral (EOPF Zarr)custom your own XYZ tile URLgeotiff your own GeoTIFF / COG file or URLgee Google Earth Engine — Sentinel-2, Landsat, NAIP or any assetImagery [esri/sentinel2/custom/geotiff/gee] (esri):2/4 AreaArea: a bounding box west,south,east,north or a vector file (.geojson, .kml, .gpkg, .shp,.parquet): 4.9375,52.3725,4.9515,52.3780zoom pixel size15 2.92 m16 1.46 m17 0.73 m18 0.36 m19 0.18 mZoom (17): 183/4 LabelsLabel file (.geojson, .kml, .gpkg, .shp, .parquet, or a .tif label raster; blank for animage-only dataset): buildings.geojsonfield example valuesclass buildingbuilding house, apartments, houseboat, yes, retailWhich field holds the class? (blank = every polygon is class 1) (): classsegmentation a class mask per patchdetection a box per object (COCO and YOLO)instance a mask per object (COCO RLE, optional instance-ID PNG)classification a label (or set of labels) per patch, as a CSVTask [segmentation/detection/instance/classification] (segmentation):4/4 Patches and outputPatch size in pixels (256):Output folder (./dataset):Split into train/val/test (spatial, no leakage)? [y/n] (y):✓ Wrote mapcv.yamlNext1. See what it will cost: mapcv plan mapcv.yaml2. Build the dataset: mapcv generate mapcv.yamlImagery terms: https://github.com/tahamukhtar20/mapcv/blob/main/PROVIDERS.mdThe area can also be a vector file (
.geojson,.kml,.gpkg,.shpor.parquet): mapcv then uses the extent of its polygons and offers the same file as labels. The result is a short, commented YAML file you can edit and commit:mapcv.yaml # mapcv config - docs: https://tahamukhtar20.github.io/mapcv/reference/configuration/# Check the cost first with `mapcv plan <this file>`, then run `mapcv generate <this file>`.# Imagery sources, their licenses and credit lines: https://github.com/tahamukhtar20/mapcv/blob/main/PROVIDERS.mdregion:west: 4.937500south: 52.372500east: 4.951500north: 52.378000imagery:type: xyzzoom: 18source: esri_satellitemax_connections: 4 # keep requests modestlabels:path: 'buildings.geojson'label_field: classsampler:patch_size: 256stride: 0 # 0 = no overlapmode: gridedge_strategy: padwriter:staging_dir: './dataset'image_format: pngsplit:strategy: spatialtest_ratio: 0.20val_ratio: 0.10Relative paths are resolved against the folder that contains
mapcv.yaml, so the config works from any directory. -
Check the cost with
Section titled “Check the cost with mapcv plan”mapcv planplanreads the labels and does the tile math, but downloads nothing:Terminal window $ mapcv plan mapcv.yaml╭─ Plan for mapcv.yaml ────────────────────────────────────────────────────────────────╮│ Region 4.9375, 52.3725 → 4.9515, 52.378 (≈ 1.0 × 0.6 km) ││ Imagery esri_satellite · zoom 18 (≈ 0.36 m/px) ││ Raster 2,816 × 1,792 px · 77 tiles (≈ 1.9 MB to download) ││ Labels buildings.geojson · 967 polygons · classes: building → 1 ││ Patches ≈ 77 × 256 px (grid, stride 256) ││ Output dataset · png (≈ 8.6 MB) ││ Split spatial · test 0.2 · val 0.1 ││ Memory ≈ 28.8 MB per chunk │╰──────────────────────────────────────────────────────────────────────────────────────╯Looks right? Build it with mapcv generate mapcv.yamlWarnings appear under the panel, for example when label features are skipped or no polygon falls inside the region. Sizes are estimates.
-
Build it with
Section titled “Build it with mapcv generate”mapcv generateTerminal window $ mapcv generate mapcv.yaml╭─ Plan for mapcv.yaml ─────────────────── (same panel as above) ──────────────────────╮╰──────────────────────────────────────────────────────────────────────────────────────╯Reading imagery and writing patches ━━━━━━━━━━━━━━━ 2/2 chunks • 0:00:21 • eta 0:00:00╭─ Dataset ready ──────────────────────────────────────────────────────────────────────╮│ Patches 77 ││ Source xyz · esri_satellite ││ Shape 256×256×3 uint8 ││ Tiles 77 fetched · 0 failed ││ Splits train 52 (68%) · val 8 (10%) · test 17 (22%) ││ Time 21s ││ Files dataset/ (Images/, Masks/, manifest.json, splits/, patches.geojson) │╰──────────────────────────────────────────────────────────────────────────────────────╯class id pixelsbackground 0 81.0%building 1 19.0%Next• Inspect it: mapcv info dataset• Re-split it: mapcv split dataset --strategy spatial• Band stats: mapcv stats dataset• Train on it: https://tahamukhtar20.github.io/mapcv/guides/use-your-dataset/If the run is interrupted, run the same command again: finished chunks are kept and it resumes. Jobs over 20,000 tiles, 5 GB or 1,000,000 patches ask for confirmation first; pass
--yesto skip the prompt. -
Inspect it with
Section titled “Inspect it with mapcv info”mapcv infoTerminal window $ mapcv info dataset╭─ dataset ────────────────────────────────────────────────────────────────────────────╮│ Task segmentation ││ Source xyz · esri_satellite ││ Bands red, green, blue ││ Patches 77 · 256×256×3 uint8 ││ CRS EPSG:3857 ││ Ignore mask value 255 marks pixels without imagery ││ Splits train 52 (68%) · val 8 (10%) · test 17 (22%) ││ Manifest version 3 │╰──────────────────────────────────────────────────────────────────────────────────────╯class id pixelsbackground 0 81.0%building 1 19.0%
What you built
Section titled “What you built”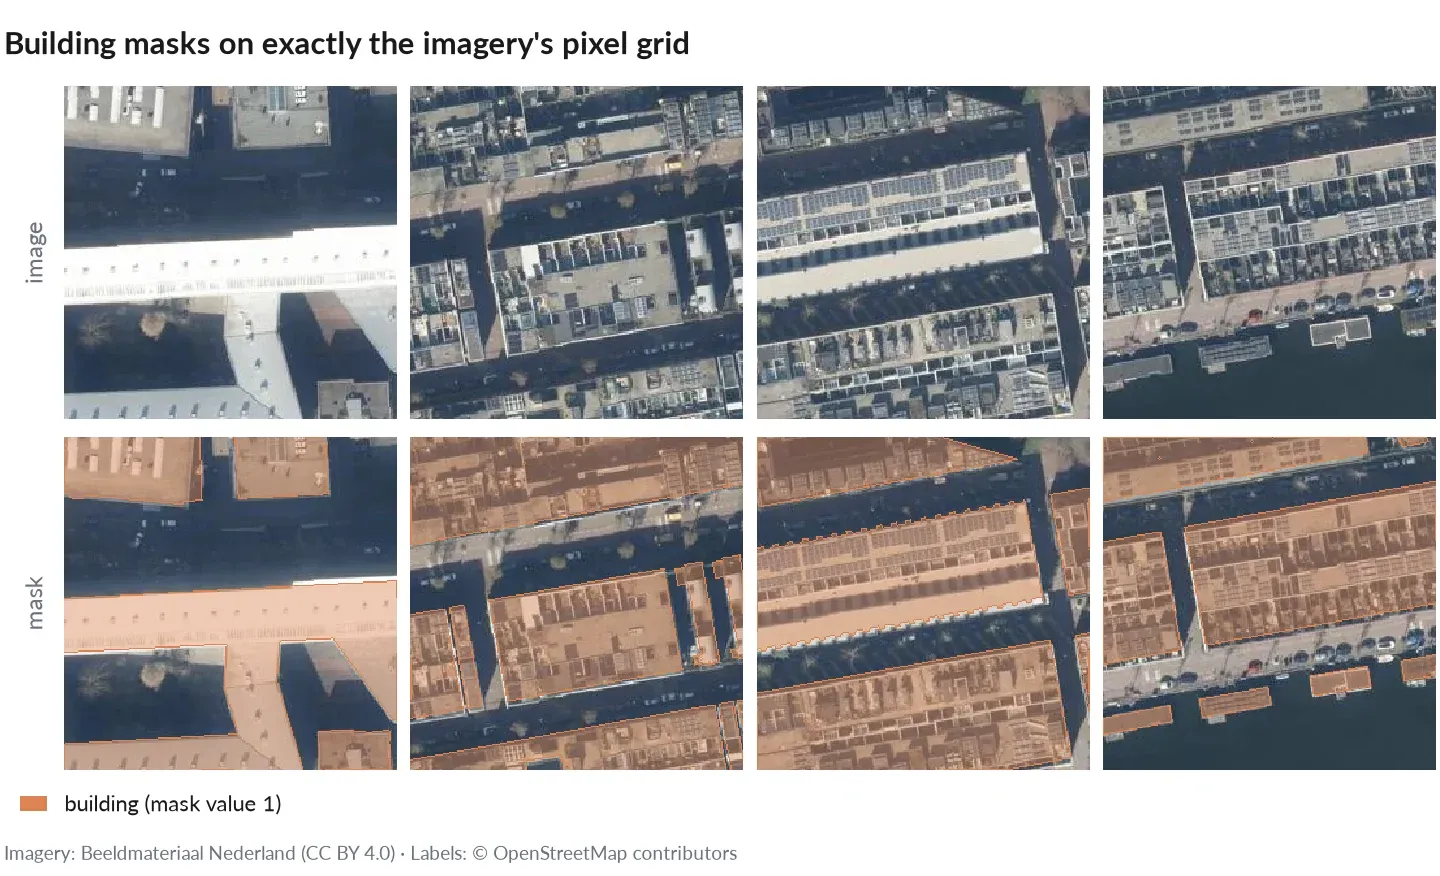
Patches and masks from this dataset’s region. Shown with Dutch open aerial imagery (Beeldmateriaal Nederland, CC BY 4.0) over the same area; with the tutorial’s Esri imagery your patches look alike.
Directorybuildings/
- mapcv.yaml
- buildings.geojson
Directorydataset/
DirectoryImages/ 77 RGB PNG patches, 256 × 256
- patch_0000000.png
- …
DirectoryMasks/ 77 single-channel PNGs: 0 = background, 1 = building
- patch_0000000.png
- …
- manifest.json
Directorysplits/
- train.txt
- val.txt
- test.txt
- split.json settings and counts of this split
Directory10/
- …
Directory20/
- …
Directory30/ labeled/unlabeled subsets of train
- …
- patches.geojson footprints of the patches, to open in QGIS
Load a pair to check that the mask lines up:
import numpy as npfrom PIL import Image
name = open("dataset/splits/train.txt").read().split()[0]image = np.asarray(Image.open(f"dataset/Images/{name}"))   # (256, 256, 3) uint8mask = np.asarray(Image.open(f"dataset/Masks/{name}"))     # (256, 256) uint8, values 0/1print(name, image.shape, mask.shape, np.unique(mask))